The Profit Dashboard is the central place for reviewing your Amazon performance in sellerboard. It displays all key profit metrics—sales, costs, fees, PPC spend, refunds, and net profit—calculated from your Seller Central data.
Use this dashboard to track performance for any time period, compare results, and drill down into product-level details.
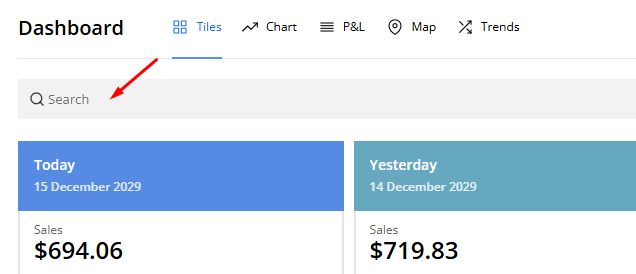
Filtering results
Users can filter by ASIN, SKU, product name, or tag to focus on specific products.
- Click on the search bar at the top.
- Enter an ASIN, SKU, product name, or tag.
- Press Enter to apply the filter.
💡Tip: You can analyze your product performance in groups by using tags. Learn how to set them up on the products page.
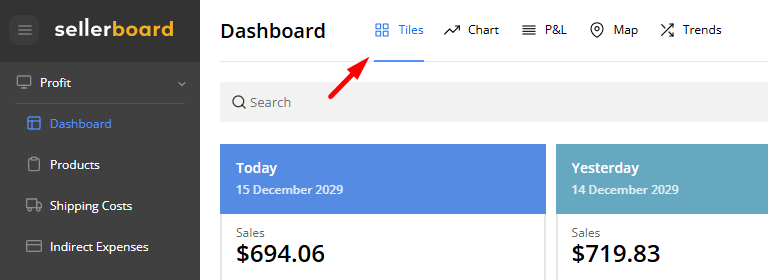
Switching views
You can switch between different views (Tiles, Chart, Table, etc.) depending on whether you want a quick snapshot, a trend overview, or a detailed breakdown.
💡Tip: You can analyze your product performance in groups by using tags. Learn how to set them up on the products page.
Selecting periods
Each view updates automatically based on the date range and filters you select.
💡Tip: You can analyze your product performance in groups by using tags. Learn how to set them up on the products page.
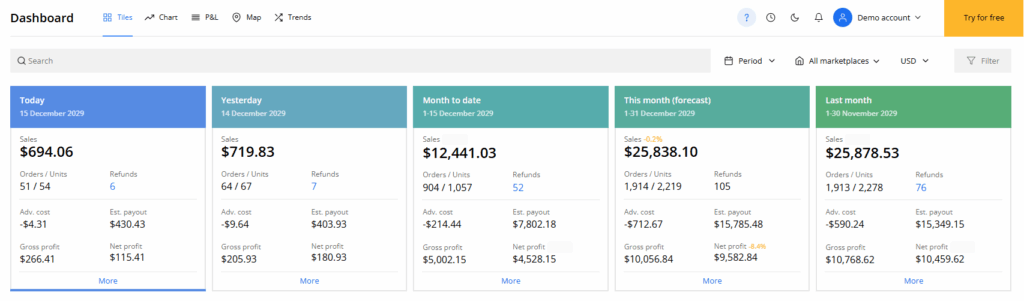
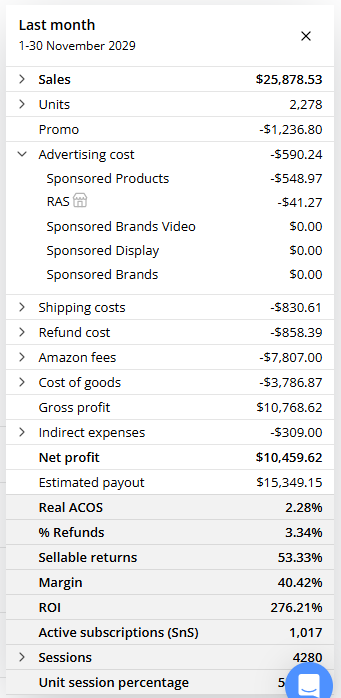
Tiles view
The Tiles View gives you a quick, visual snapshot of your performance across five key time periods. Each tile shows essential KPIs and can be expanded to reveal a full breakdown of all costs, fees, and factors that make up your profit.
How can I filter the data in the tiles view?
Users can filter by ASIN, SKU, product name, or tag to focus on specific products.
- Click on the search bar at the top.
- Enter an ASIN, SKU, product name, or tag.
- Press Enter to apply the filter.
💡Tip: You can analyze your product performance in groups by using tags. Learn how to set them up on the products page.
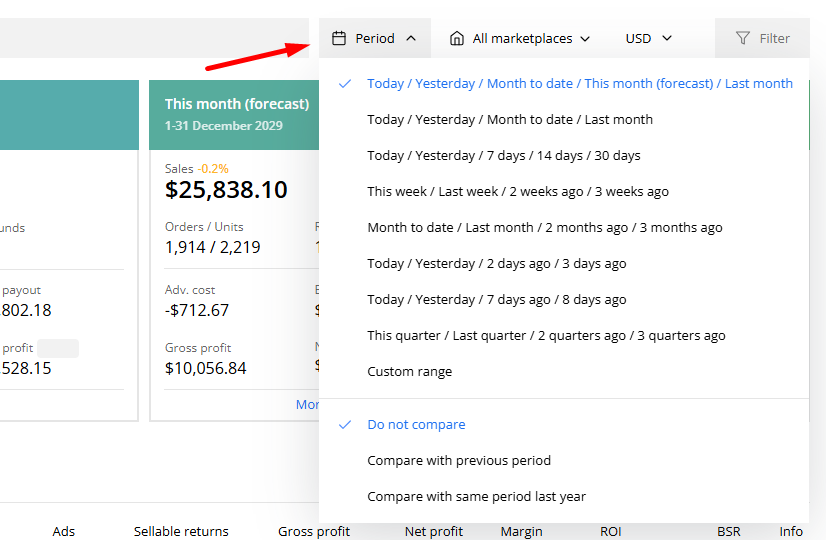
How do I select a custom time period for analysis?
Users can analyze data across different timeframes.
- Click on the Period dropdown (calendar icon).
- Choose a preset period (e.g., Today, Last Month) or select Custom Range.
- If using a custom range, select start and end dates, then confirm.
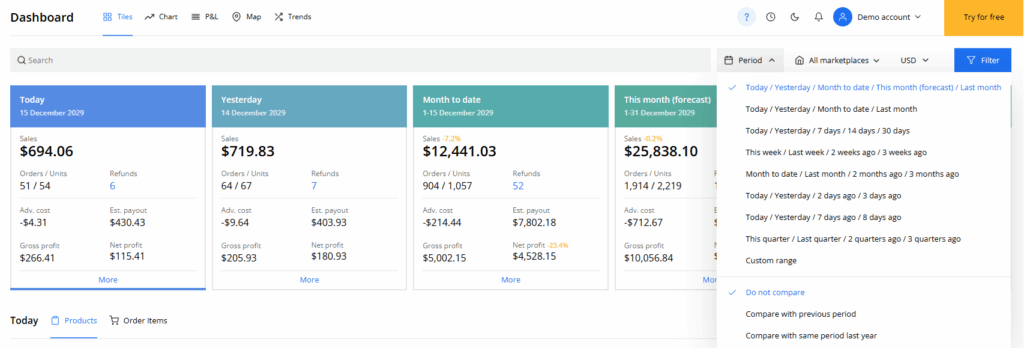
💡Tip: You can also set custom periods for each individual tile by clicking on the date at the top-left of the tile.
How do I compare data from two different periods?
Users can compare two periods directly within the tiles.
- Click on the Period dropdown.
- Check the Compare with previous period box.
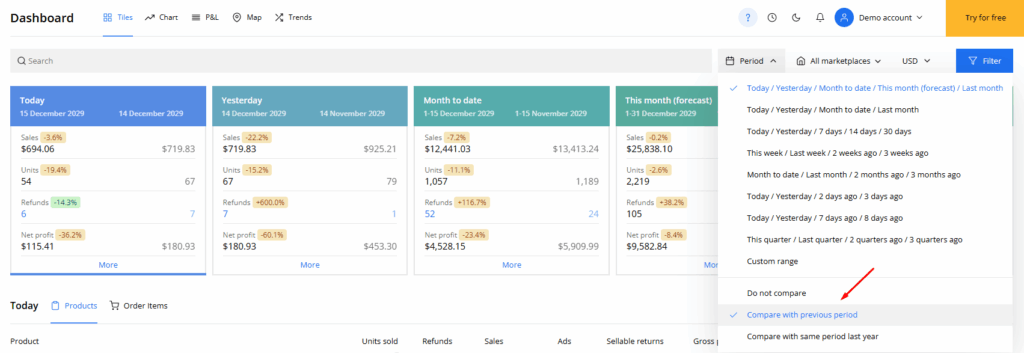
- Select a second time period on the tiles you want to compare.
How do I filter data by marketplace?
Users can view financial data for specific Amazon marketplaces.
- Click on the All Marketplaces dropdown.
- Select or deselect marketplaces to adjust the data.
- Click Filter to save the selection.
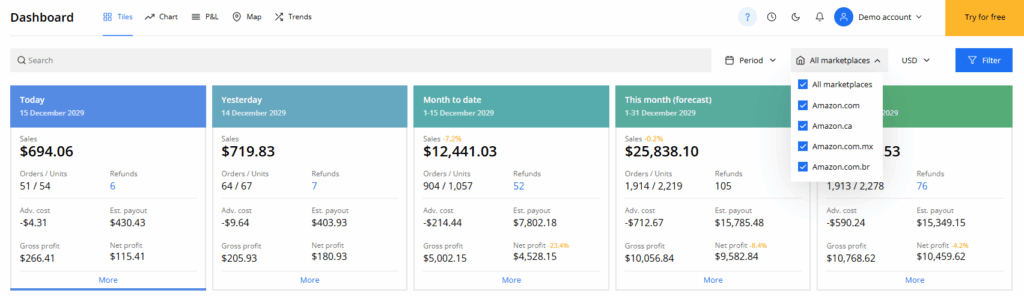
Chart view
The Chart View helps you visualize key performance trends over time, making it easy to spot patterns, seasonality, and sudden changes in your Amazon business. With flexible metrics and fully adjustable time ranges, the chart gives you a clear, intuitive understanding of how your profit drivers evolve day-to-day, week-to-week, or month-to-month.
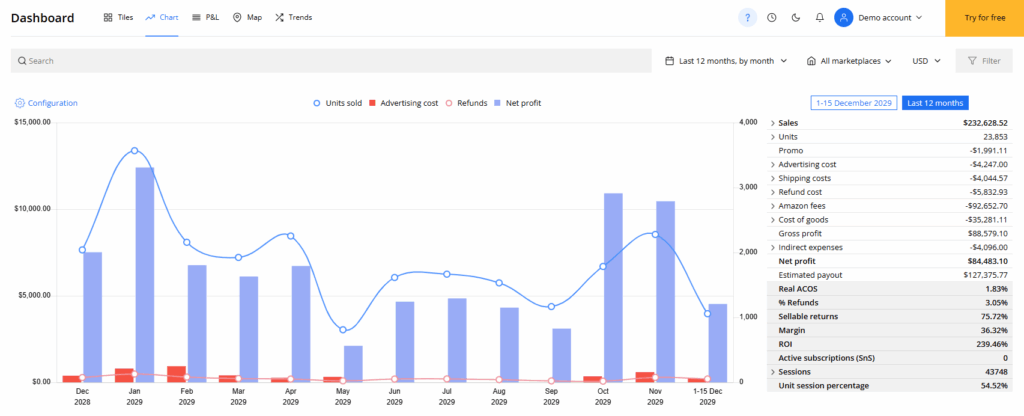
How can I switch between different KPIs in the chart?
You can select any KPI from the metric dropdown above the chart. The view updates instantly, allowing you to compare trends across sales, profit, units, refunds, COGS, PPC spend, and more.
The expanded view also includes Real ACOS, giving you a precise measure of how your ad spend relates to total sales.
NOTE: To start accounting for your Amazon PPC advertising costs, make sure to connect the Advertising API.
P’n’L view
The P&L View displays a structured profit and loss table for the selected period. It summarizes all revenue, cost, and fee components that contribute to your profit. Columns represent months, weeks, or days, depending on the chosen date range, and rows show each metric involved in the calculation.
You can scroll horizontally to compare periods and open expandable rows for detailed components where available. The filter bar allows you to adjust the date range, switch marketplaces, or limit the view to specific products, SKUs, or tags. The Products section beneath the table automatically reflects the same filters and date range, showing item-level profitability for the period you’re reviewing.
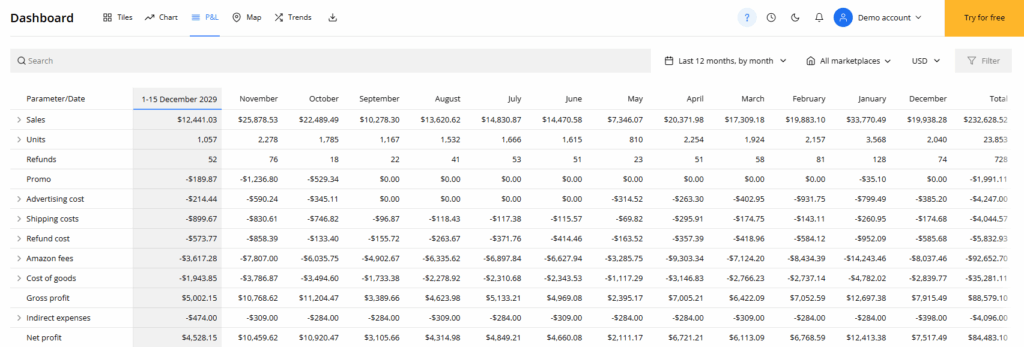
Can I export P&L results?
You can quickly gauge your total ad spend by checking the Adv. cost metric shown on each tile.
For a deeper breakdown, click More to expand the tile and view all advertising costs by campaign type—Amazon PPC, Sponsored Products, Sponsored Brands, and any connected external channels like Meta or TikTok.
The expanded view also includes Real ACOS, giving you a precise measure of how your ad spend relates to total sales.
NOTE: To start accounting for your Amazon PPC advertising costs, make sure to connect the Advertising API.
Map view
The Map View provides a geographic breakdown of your performance for the selected period. You can switch between Sales and Stock to see how activity and inventory are distributed across regions. For the USA, data is shown per state; for all other marketplaces, data is grouped by country.
The map highlights regions based on intensity (higher sales or stock are shown in darker colors). Below the map, a table lists each region with its key metrics, and you can expand regions to view ASIN-level details. The filters at the top let you adjust the date range, marketplace, and visible metrics.
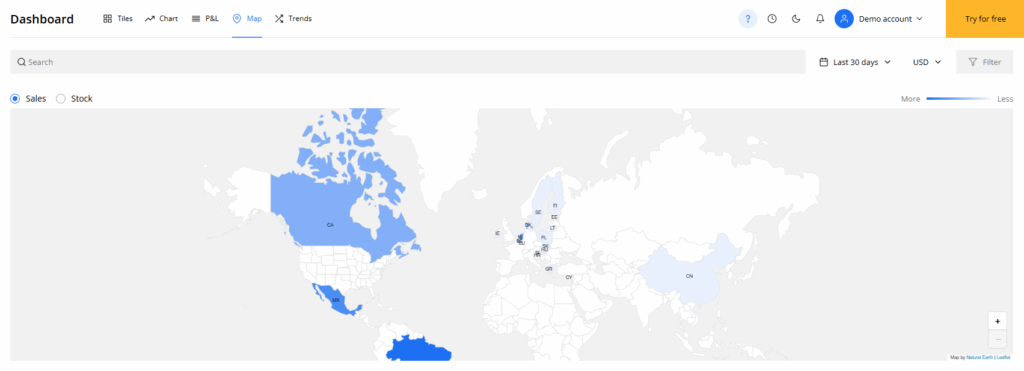
How do I switch between Sales and Stock?
You can quickly gauge your total ad spend by checking the Adv. cost metric shown on each tile.
For a deeper breakdown, click More to expand the tile and view all advertising costs by campaign type—Amazon PPC, Sponsored Products, Sponsored Brands, and any connected external channels like Meta or TikTok.
The expanded view also includes Real ACOS, giving you a precise measure of how your ad spend relates to total sales.
NOTE: To start accounting for your Amazon PPC advertising costs, make sure to connect the Advertising API.
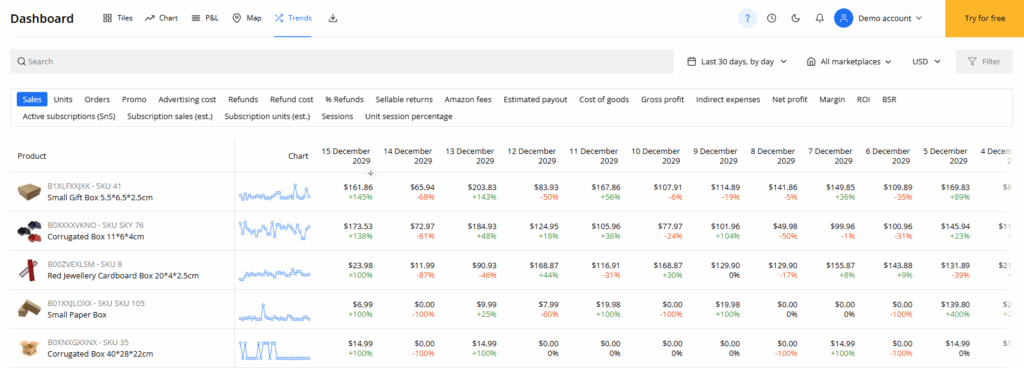
Trends view
The Trends View shows how key metrics change over time for each product.
It displays one row per product and provides small line charts or numeric changes for the selected period, allowing you to compare performance across products and identify patterns such as growth, decline, seasonality, or unusual shifts.
You can switch between daily or monthly trends depending on the selected date range. Filters allow you to narrow the list to specific SKUs, tags, or marketplaces. The table is fully sortable, so you can quickly highlight rising products, declining ones, or those with notable changes in profit, sales, or refunds.
How do I identify underperforming or high-potential products?
You can quickly gauge your total ad spend by checking the Adv. cost metric shown on each tile.
For a deeper breakdown, click More to expand the tile and view all advertising costs by campaign type—Amazon PPC, Sponsored Products, Sponsored Brands, and any connected external channels like Meta or TikTok.
The expanded view also includes Real ACOS, giving you a precise measure of how your ad spend relates to total sales.
NOTE: To start accounting for your Amazon PPC advertising costs, make sure to connect the Advertising API.